
HOW TO SHOW DASHBOARD IN EXPERIENCE CLOUD
- S. Dash

- Apr 4, 2024
- 3 min read

Hey learners, In the ever-evolving landscape of Salesforce, dashboards emerge as indispensable tools, a dashboard is a visual representation of key metrics, data, and reports that provide users with a real-time snapshot of their business performance. It's a centralized, customizable interface that allows users to monitor and analyze data from various sources within the Salesforce platform.
What are dashboards used for?
Visual Representation: Dashboards in Salesforce are highly visual, utilizing charts, graphs, tables, and other graphical elements to represent data. This visual representation makes it easy for users to grasp trends, patterns, and insights quickly.
Performance Monitoring: Dashboards are often used to monitor the performance of sales teams, marketing campaigns, customer service operations, and other business processes. Key performance indicators (KPIs) are prominently displayed for quick reference.
Real-Time Data: Salesforce dashboards can display real-time data, offering an up-to-the-minute view of business performance. This feature is crucial for making informed and timely decisions.
Customization: Users can customize their dashboards to display the information most relevant to their roles and objectives. Salesforce provides a range of components and widgets that can be added to dashboards, including charts, metrics, and reports.
In this blog, I will share the knowledge of how you can show a dashboard in an experience cloud site. I have created an example Account report and dashboard just to show you how to use it.
Step 1: Enable experience cloud
First of all, In this step, I have enabled the experience cloud site with the name Blog Project and created a site template for this.
Setup >> Digital Experience >> Settings >> Enable Digital Experience >> Save >> a popup will appear >> click Ok >> click open >> Select any Aura site template
Step 2: Create a Report
If we have any report already created we can ignore this step. If not then create a report.
In this step, I have created a report named Account Report so that we can show that report in the dashboard.
Go to Report >> Click on New Report >> Select Report Type Name >> Click on Start Report.

Add Report to a folder named Public Folder and Click on Save.

You can also refer to this article for creating a report
Step 3: Add Report to Dashboard
● In this step, I mentioned adding a report to the dashboard.

Click on Add to Dashboard
Click on Add to the new dashboard
Created a folder for the Dashboard named Account Dashboard Folder.(You will have to create this folder)
Select a dashboard folder >> Add.

You can refer to this article for creating a dashboard
Step 4: Select How we want to display
In this step, we can choose how we want to show our report in the dashboard.
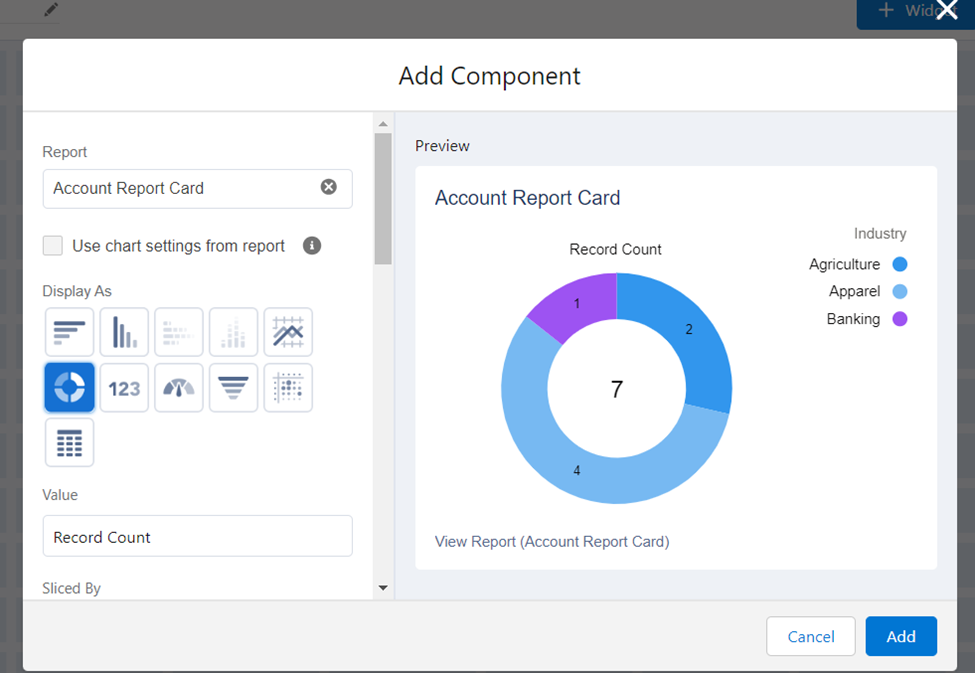
Select what type of graph we want to show.
Click on Add.
Click on Save.
Step 5: Add Dashboards into Experience Cloud.
In this step, we will see how to add our dashboard to the Experience Cloud site.
Go to the dashboard tile in Experience Cloud

Select the dashboard named Account Dashboard.
Click on Save.
Go to the builder tile to add a dashboard.
Drag the dashboard into the layout.

Select the dashboard you have created. Here I have created a dashboard named Account Dashboard, so I will select that only.
Now we have created the dashboard. Now the dashboard will appear.

Conclusion
In summary, integrating dashboards into an Experience Cloud site in Salesforce empowers users to visualize and monitor key business metrics effectively. This process, from enabling Experience Cloud to customizing and displaying dashboards, enhances decision-making and strategic planning by providing real-time insights. Through these steps, we've showcased how Salesforce's dynamic capabilities can improve operational efficiency and transparency across an organization. With this guide, you're well-prepared to leverage the full potential of Salesforce dashboards, turning data into a powerful tool for navigating your business landscape.
If you'd like to see the code and resources used in this project, you can access the repository on GitHub.To access the AVENOIRBLOGS repository, click here. Feel free to explore the code and use it as a reference for your projects.
Thank You! You can leave a comment to help me understand how the blog helped you. If you need further assistance, please contact us. You can click "Reach Us" on the website and share the issue with me.
Reference
https://www.avenoir.ai/post/history-object-in-salesforce-flows
https://www.avenoir.ai/post/experience-cloud-site-login-page-development-from-scratch-using-aura
https://www.avenoir.ai/post/experience-cloud-site-login-page-development-from-scratch-using-lwc
https://help.salesforce.com/s/articleView?id=sf.reports_build_lex.htm&type=5
https://help.salesforce.com/s/articleView?id=sf.dashboards_create_lex.htm&type=5
https://developer.salesforce.com/docs/atlas.en-us.exp_cloud_lwr.meta/exp_cloud_lwr/intro.htm
https://help.salesforce.com/s/articleView?id=sf.improving_dashboard_performance.htm&type=5
https://help.salesforce.com/s/articleView?id=sf.rd_reports_dashboards_limits_overview.htm&type=5
Blog Credit:
S. Dash
Salesforce Developer
Avenoir Technologies Pvt. Ltd.
Reach us: team@avenoir.ai

Are you in need of Salesforce Developers?
Reach Us Now!


Read "HOW TO SHOW DASHBOARD IN EXPERIENCE CLOUD" a moment ago, and it gave me a useful reminder to stay intentional. I will revisit this post again. address generator online